PCH-Prevention and Control of Health, is a social program thought and designed to help people.
Should be well specified, this app is purely advisory, it will reflect the state of your health. It does not want and can not replace the Doctor. It warns of irregularities in your health and alerts you if you should go to a Doctor! This is called Prevention and Control. The site is a support for the presentation of PCH and mentoring program for the application.
The application is very suitable for doctors, nurses, specialized staff in the field, etc. But equally well be used by anyone, is very useful in caring family, your personnel.
It is useful, when you have a man in elderly care, children, person with disabilities, etc. The facilities, which stacks (online alarm, SMS), setting limits, opportunities in medical technology, you can watch and to correct certain variables. Many electronic measuring equipment applications have their own facilities.
Thermometers, sphygmomanometers, scales, etc. via sensors incorporated, can transmit (as you choose) periodic measurement result: 10 in 10 seconds, 10 minutes, 15 minutes, etc as you need.
It can be used in case of emergencies: in airports, auditoriums, gyms, for selections in case of infection, epidemics. Is know as temperature, weight loss, blood pressure, etc. are very important variables in identifying such state.
A thermometer (or more) non contact (non-invasive) with infrared, they can be controlled hundreds, thousands of persons in a timely manner. With Scales transmission BT (Bluetooth) also may investigate a large number of people (know that in certain cases of infection, installs diarrhea, which decreases his weight visibly in a small time). Situations of collective panic, agitation, etc. lead to increased blood pressure. All this can be quickly recorded and transmitted directly to your doctor, clinics, hospitals, etc.
The application is divided into modules, which can be updated each or others can be added.
It is continuously improved.
- For now we designed this form comprising a minimum of analysis modules (12), 3 test modules and 4 help modules.
- We tried to introduce a minimum range required, to familiarize the user with this type of application and generate interest.
- We will try to familiarize the user with minimum knowledge necessary to diagnose, care for, even help others.
- There is no constraint, conditionings.
You can use any device: a classic thermometer, a bathroom scales, a meter tailoring, etc. If you can not afford a glucometer, an ECG, a blood pressure, there are centers that are free booklets these measurements at a hospital, every clinic, something you near. But now prices for medical equipment, necessary minimum investment is minor, considering the stakes: your health.
This chapter will help you improve your minimum required knowledge, enlightening you about the purpose of the application, to give you direction in its use, etc. Try, considering the higher volume of information to be accumulated gradually, or depending on the desired direction required. Specifically, only what you need or you are interested. We have in mind, if feedback is positive, to extend our analysis, the tests and advice. Next we study and develop each module. We will add examples from You Tube, tables, graphs, etc.
Factors influencing the RESULT of medical tests
1. Race
- Salivary Amylase pancreatic especially is higher in Asians than in Europeans.
- The number of leukocytes blood is lower in blacks compared to whites subjects (due to significantly lower the number of granulocytes).
2. Age
- There is a variation of hemoglobin, uric acid and bilirubunei in the first days of life.
- Physiological lymphocytosis child; the same amount for adults is pathological (check and outcome in absolute values, not only in percentages).
- Alkaline phosphatase has a peak activity during the period of growth, falling gradually to 20 years
- Cholesterol and LDL cholesterol varies with age
- PSA blood concentration is increased beyond 50 years
3. Sex
4. Variables physiological (pregnancy, menstruation, menopause)
- Pregnancy – Increase the plasma volume, urine volume, ESR up to 5 times the normal amount, no change of hormones, enzymes, electrolytes and proteins.
- During the menstrual cycle, preovular: grow renin and cholesterol, lower phosphate and iron.
- For children there are physiological lymphocytosis and anemia between 8 months and one year, the same values found in an older age becomes pathological.
5. Environmental Factors
- Ambient temperature
- Water quality
6. Food Intake
- Increase the fed – triglycerides, ALT, glucose, bilirubin, albumin, phosphate, SGOT, potassium, uric acid, proteins, albumin, calcium, urea, cholesterol and sodium / LDH – decreases
- Item prolonged decrease in blood-protein, cholesterol, triglycerides, urea, and T3, T4
- Increase in blood creatinine and uric acid- Increases in ammonia and urine creatinine / decrease in urine urea, calcium and phosphate
It recommends a fasting period before collection of blood samples for at least 4 hours, standard time set is 12 hours.
7. The ingestion of Alcohol
- Increases uric acid and lactate
- Decreases glucose
- Metabolic acidosis
- Decreases uric acid excretion
Chronic ingestion:
- GGT increase, SGPT, SGOT and triglycerides
8. Smoking
- Grew the number of white blood cells, red blood cells, fibrinogen, lead, cholesterol, LDL cholesterol, triglycerides
- Lowers HDL cholesterol, IgA, IgG and IgM
9. Exercise
10. Stress
- Grow-hormones, fibrinogen, glucose, albumin, insulin, lactate, cholesterol
We recommend sampling after 12 hours of reduced physical activity and physical rest 30 minutes minimum.
11. The use of medicinal ~
12. Immobilisation
- Grows the hematocrit of the excretion of nitrogen, calcium, sodium, potassium, phosphate
- Lowers proteins, TGO, CK, potassium
13. Surgery
- Grow reactants acute phase, CK, SGOT, LDH, urea, leukocytes, platelets
- Lowers cholesterol, albumin
14. Fever
- Grow glucose, urea, uric acid, acute phase reactants of
- Decreases Cholesterol
Very important
Bluetooth option: data for permission request.
Settings > Wireless & Nework > Bluetooth settings > press Bluetooth to Turn on Bluetooth,and then press ”Scan for Devices” to find the Thermometer device in range (this must to be ON).
The Thermometer device name should be like “xxxxxxxx” wich starts with one letter and followed a 7-digits number. Press the Thermometer device to pair with the“PIN”(XXXX). Once the thermometer device is paired we may use our apps.
Temperature
In version “Manual” will have the following registration methods:
Data from the classic thermometer, a non contact IR (infrared, who measure and surface temperature), Ear thermometer, etc.
Limit of body temperature: 30 ºC to 42.5 ºC / 6 º F to 109 ºF.
These are the extreme limits of the human body temperature.
Normal temperature of a human is between 36.5 ºC (97.7 º F) to 3 am in the morning and 37.2 ºC (98.96 ºF) to 6am in the evening. Therefore we programing our application, when these limits are exceeded, to be audible and visual warning. We may record, in Notes, and additional data as surface temperature, milk, bath water, etc. To prompt the best temperature of baby milk temperature, of bath temperature, and temperature of sleep,etc:
- Milk temperature :37 ºC/98.5 ºF
- Bath temperature: between 37 ºC-38C º and 36 ºC for new born
- Sleep(room) temperature: 16 ºC-20C º,ideal 18C º (65F º)
- Normal temperature for baby: 36 ºC -36.8 ºC/97.7 ºF-99.7 ºF
About the importance of checking the temperature, how it behaves.
The Constant Growth vs. Random Increase
In general, it is considered normal basal body temperature 37 ° C. However, this varies from one individual to another, even over a day, or depending on the weather. Also, always keep in mind the place you choose for determination: core temperature, measured at intra-oral or rectal is usually higher by 0.5-1 ° C (0.6 ° C average) than that measured in the axilla (underarm). The most accurate measurement, especially recommended for children (those who agree to this horror) is version intra-rectally as a risk that this region is influenced by environmental factors that decrease or increase the temperature recorded thermometer it is very small.
The reference temperature is generally of 36.5ºC. If you follow temperature for a few days and observe a steady increase of 0.3º-0.5ºC every day, this could result in 5-7 days at a temperature of 40ºC. This increase is the net result of an infection, an installation of a disease.So if we realize that growth is constant, we can immediately cause for alarm, and to win 4-5 days. Time in which to take measures which may prove life saving. It is very important, especially to children, elderly, who are more exposed. Similarly we can follow and steady weight loss, constant growth of glycemia, blood pressure etc. That argues for the importance of prevention and health control (PCH)
The degree temperature increase, we have the following statuses:
- Feverish: 37-38 ° C
- Febrile moderate: 38-39 ° C
- High 39-41 ° C
- Hyperpyrexia: 41-42 ° C
Hyperpyrexia is considered a medical emergency, it indicates a serious underlying condition (sepsis, intracerebral hemorrhage, etc.)
Basal body temperature (BBT) is the lowest body temperature attained during rest (usually during sleep). It is usually estimated by a temperature measurement immediately after awakening and before any physical activity has been undertaken. This will lead to a somewhat higher value than the true BBT. For more accurate results, it is determined by using internally worn temperature loggers. In women, ovulation causes an increase of one-half to one degree Fahrenheit (one-quarter to one-half degree Celsius) in BBT; monitoring of BBTs is one way of estimating the day of ovulation. The tendency of a woman to have lower temperatures before ovulation, and higher temperatures afterwards, is known as a biphasic pattern. Charting of this pattern may be used as a component of fertility awareness. The BBT of men is comparable to the BBT of women in their follicular phase.
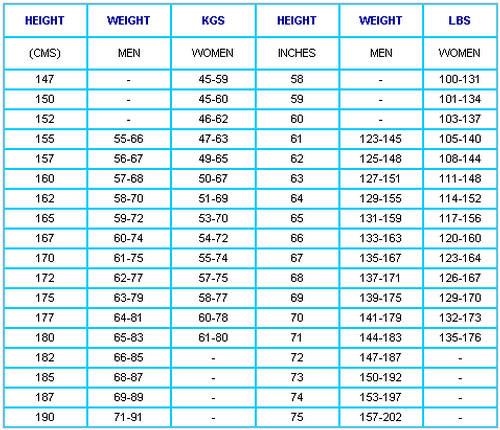
Height
Manual registering: The simplest and cheapest shot of our application.We can use anything: a ruler, a tape measure, tailor meter, etc..The most practical is the doorframe.Marked with a pencil (which can then delete), because such children grow.We use a comparison chart for kids and teens to check growth.There laser measuring tape that we can use, but do not justify the investment.
Bluetooth registering: I will give some applications of Google Play for measuring distances and heights. If you can adapt for our application, or if it helps somehow, to do something just like them.Data from Height, we will use with the Weight, for BMI (Body Mass Index).
Weight
Being a healthy weight has important benefits, not only on how you feel, but also for lowering your risk of heart disease, joint pain and a range of other conditions.
So what’s an ideal weight range for you? As a general rule, a healthy weight for your height would mean your body mass index (BMI) – a calculation that doctors use to simply assess your health risk – would be between 20 and 25.
In our app, you have an BMI calculator. In the future, we will develop this chapter, we will add more measurement criteria. Now we do not want to complicate the user, we have only basic.
Blood Glucose
Manual registering:
- First, set out your glucometer, a test strip, a lancet and an alcohol prep pad.
- Wash your hands to prevent infection.
- Decide where you are going to obtain the blood from, usually a finger. Some of the newer monitors let you use your forearm or another less sensitive place.
- Sometimes it helps to warm your hands first to make the blood flow easier. You can rub your hands together briskly or run them under warm water.
- Turn on the glucometer and place a test strip in the machine when the machine is ready. Watch the indicator for placing the blood to the strip.
- Make sure your hand is dry and wipe the area you’ve selected with an alcohol prep pad and wait until the alcohol evaporates.
- Pierce your finger tip on the soft, fleshy pad and obtain a drop of blood. The type of drop of blood is determined by the type of strip you are using (some use a “hanging drop” of blood versus a small drop for strips that draw blood in with a capillary action).
- Place the drop of blood on or at the side of the strip.
The glucometer will take a few moments to calculate the blood sugar reading. Follow your doctor’s orders for whatever blood sugar reading you get. You may use the alcohol prep pad to blot the site where you drew the blood if it is still bleeding.
Write down (in glucose picker) your results. Keeping a record makes it easier for you and your doctor to establish a good treatment plan. Some glucometers can store your results in a memory, for easier record keeping. The procedure for analysis of cholesterol, triglycerides, uric acid, etc. is identical. But you will find in the instruction manual of the devices, all details.
TESTING
There are a range of tests which will need to be done to monitor your health and your diabetes. Some of these, such as your blood glucose levels, you will be able to do yourself. Others will be done by healthcare professionals.
- Blood glucose levels
- Urine testing
- HbA1c (Glycated haemoglobin) and fructosamine
- Blood pressure (hypertension)
- Blood fats (lipids)
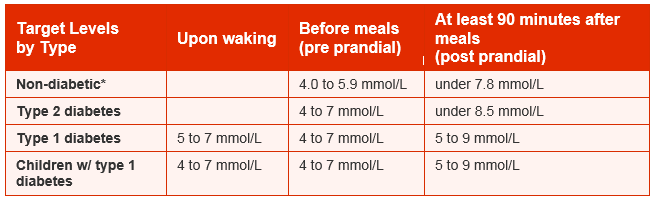
Blood glucose levels Self-monitoring of blood glucose can be a beneficial part of diabetes management. As part of the day-to-day routine it can help with necessary lifestyle and treatment choices as well as help to monitor for symptoms of hypo- or hyperglycaemia. Monitoring can also help you and your healthcare team to alter treatment which in turn can help prevent any long-term complications from developing. Some people with diabetes (but not all) will test their blood glucose levels at home. Home blood glucose testing gives an accurate picture of your blood glucose level at the time of the test. It involves pricking the side of your finger (as opposed to the pad) with a finger-pricking device and putting a drop of blood on a testing strip. Some people can’t see the point of testing as they think they know by the way they feel, but the way you feel is not always a good or accurate guide to what is happening. Blood glucose targets It is important that the blood glucose levels being aimed for are as near normal as possible (that is in the range of those of a person who does not have diabetes). These are:
- 3.5–5.5mmol/l* before meals
- less than 8mmol/l, two hours after meals
There are many different opinions about the ideal range to aim for. As this is so individual to each person, the target levels must be agreed between the person and their diabetes team. The target blood glucose ranges below are indicated as a guide. Children with Type 1 diabetes (NICE 2015)
- on waking and before meals: 4–7mmol/l
- after meals: 5–9mmol/l.
Adults with Type 1 diabetes (NICE 2015)
- on waking: 5–7mmol/l
- before meals at other times of the day: 4–7mmol/l
- 90 minutes after meals: 5–9mmol/l.
Type 2 diabetes (Diabetes UK Council of Healthcare Professionals 2015)**
- before meals: 4–7mmol/l
- two hours after meals: less than 8.5mmol/l.
Pregnant women with diabetes (NICE 2015)
- fasting: below 5.3mmol/l and
- 1 hour after meals: below 7.8mmol/l or
- 2 hours after meals: below 6.4mmol/l
*millimoles per litre: a measurement of the concentration of a substance in a given amount of liquid
With a single multiple devices, you can control blood sugar, cholesterol and uric acid. High Concentrations of uric acid blood can lead to gout. The chemical is Associated with Other Medical Conditions Including diabetes and the formation of ammonium acid urate kidney stones.

International standard for measuring blood glucose in mmol / l
The American system of measurement is in mg / dl
Transformation in mmol / l mg / dl is very simple, multiplied by 18.
For example: 5 mml / L = 18 x 5 = 90 mg / dl
Blood Pressure
Blood pressure (BP) is the pressure exerted by circulating blood upon the walls of blood vessels. When used without further specification, “blood pressure” usually refers to the arterial pressure in the systemic circulation. Blood pressure is usually expressed in terms of the systolic (maximum) pressure over diastolic (minimum) pressure and is measured in millimeters of mercury (mm Hg). It is one of the vital signs along with respiratory rate, heart rate, oxygen saturation, and body temperature. Normal resting systolic (diastolic) blood pressure in an adult is approximately 120 mm Hg (80 mm Hg), abbreviated “120/80 mm Hg”.
Blood pressure varies depending on situation, activity, and disease states. It is regulated by the nervous and endocrine systems. Blood pressure that is low due to a disease state is called hypotension, and pressure that is consistently high is hypertension. Both have many causes which can range from mild to severe. Both may be of sudden onset or of long duration. Long term hypertension is a risk factor for many diseases, including heart disease, stroke and kidney failure. Long term hypertension is more common than long term hypotension in Western countries. Long term hypertension often goes undetected because of infrequent monitoring and the absence of symptoms.
Systemic arterial pressure
The table presented here shows the classification of blood pressure adopted by the American Heart Association for adults who are 18 years and older. It assumes the values are a result of averaging resting blood pressure readings measured at two or more visits to the doctor.
In the UK, clinic blood pressures are usually categorized into three groups; low (90/60 or lower), normal (between 90/60 and 139/89), and high (140/90 or higher).
Blood pressure fluctuates from minute to minute and normally shows a circadian rhythm over a 24-hour period, with highest readings in the early morning and evenings and lowest readings at night.Loss of the normal fall in blood pressure at night is associated with a greater future risk of cardiovascular disease and there is evidence that night-time blood pressure is a stronger predictor of cardiovascular events than day-time blood pressure.
Various factors, such as age and sex, influence a person’s blood pressure and variations in it. In children, the normal ranges are lower than for adults and depend on height.Reference blood pressure values have been developed for children in different countries, based on the distribution of blood pressure in children of these countries.As adults age, systolic pressure tends to rise and diastolic tends to fall. In the elderly, systolic blood pressure tends to be above the normal adult range, thought to be largely because of reduced flexibility of the arteries. Also, an individual’s blood pressure varies with exercise, emotional reactions, sleep, digestion and time of day (circadian rhythm).
Differences between left and right arm blood pressure measurements tend to be random and average to nearly zero if enough measurements are taken. However, in a small percentage of cases there is a consistent difference greater than 10 mm Hg which may need further investigation, e.g. for obstructive arterial disease.
The risk of cardiovascular disease increases progressively above 115/75 mm Hg. In the past, hypertension was only diagnosed if secondary signs of high arterial pressure were present, along with a prolonged high systolic pressure reading over several visits. Regarding hypotension, in practice blood pressure is considered too low only if noticeable symptoms are present.
Clinical trials demonstrate that people who maintain arterial pressures at the low end of these pressure ranges have much better long term cardiovascular health. The principal medical debate concerns the aggressiveness and relative value of methods used to lower pressures into this range for those who do not maintain such pressure on their own. Elevations, more commonly seen in older people, though often considered normal, are associated with increased morbidity and mortality.
Classification of blood pressure for adults
| Category | Systolic, mm Hg | Diastolic, mm Hg |
|---|---|---|
| Hypotension | < 90 | < 60 |
| Desired | 90 – 119 | 60 – 79 |
| Prehypertension | 120 – 139 | 80 – 89 |
| Stage 1 hypertension | 140 – 159 | 90 – 99 |
| Stage 2 hypertension | 160 – 179 | 100 – 109 |
| Hypertensive urgency | ≥ 180 | ≥ 110 |
| Isolated systolic hypertension | ≥ 160 | < 90 |
Classification of blood pressure for adults
| Stage | Approximate age | Systolic | Diastolic |
|---|---|---|---|
| Infants | 1 to 12 months | 75 – 100 | 50 – 70 |
| Toddlers and preschoolers | 1 to 5 years | 80 – 110 | 50 – 80 |
| School age | 6 to 12 years | 85 – 120 | 50 – 80 |
| Adolescents | 13 to 18 years | 95 – 140 | 60 – 90 |
EEG (Electroncephalogram)
Manual / Bluetooth – The only difference between Manual and Bluetooth is:
In alternative to so-called Manual, the device releases a diagram on paper. It can be handed over directly to the doctor or scanned and sent on On line / fax.
In version WiFi / Bluetooth, the result is sent directly to the smartphone form of a chart.
We have no units, because in both cases the results are a graphical representation. This analysis must be “interpreted” by a specialist. We can send findings from reviews directly from smartphones and experts to respond or we shall send our doctor as soon result. In both cases we must have a minimum training stage for using the device.
Electroencephalography (EEG) is the recording of electrical activity along the scalp. EEG measures voltage fluctuations resulting from ionic current flows within the neurons of the brain. In clinical contexts, EEG refers to the recording of the brain’s spontaneous electrical activity over a short period of time, usually 20–40 minutes, as recorded from multiple electrodes placed on the scalp.
A routine clinical EEG recording typically lasts 20–30 minutes (plus preparation time) and usually involves recording from scalp electrodes. Routine EEG is typically used in the following clinical circumstances:
- to distinguish epileptic seizures from other types of spells, such as psychogenic non-epileptic seizures, syncope (fainting), sub-cortical movement disorders and migraine variants.
- to differentiate “organic” encephalopathy or delirium from primary psychiatric syndromes such as catatonia
- to serve as an adjunct test of brain death to prognosticate, in certain instances, in patients with coma.
To publish your photo in Monitor selection proceed in the following manner:
Go to the ECG module, access manual mode and you will see the following screen.
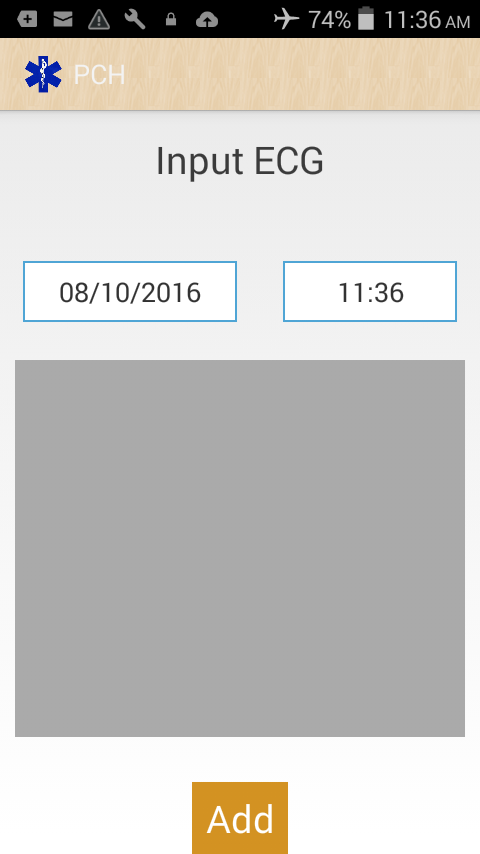
Click in the gray area and send in photos or Gallery.
From here you can load (to Monitor Selection) desired image:

ECG-EKG
Electrocardiography (ECG or EKG*) is the process of recording the electrical activity of the heart over a period of time using electrodes placed on the skin. These electrodes detect the tiny electrical changes on the skin that arise from the heart muscle’s electrophysiologic pattern of depolarizing during each heartbeat.
It is a very commonly performed cardiology test.
In a conventional 12-lead ECG, 10 electrodes are placed on the patient’s limbs and on the surface of the chest. The overall magnitude of the heart’s electrical potential is then measured from 12 different angles (“leads”) and is recorded over a period of time (usually 10 seconds). In this way, the overall magnitude and direction of the heart’s electrical depolarization is captured at each moment throughout the cardiac cycle. The graph of voltage versus time produced by this noninvasive medical procedure is referred to as an electrocardiogram.
Stethoscopes
The stethoscope is an acoustic medical device for auscultation, or listening to the internal sounds of an animal or human body. It is often used to listen to lung and heart sounds. It is also used to listen to intestines and blood flow in arteries and veins. In combination with a sphygmomanometer, it is commonly used for measurements of blood pressure. Less commonly, “mechanic’s stethoscopes” are used to listen to internal sounds made by machines, such as diagnosing a malfunctioning automobile engine by listening to the sounds of its internal parts. Stethoscopes can also be used to check scientific vacuum chambers for leaks, and for various other small-scale acoustic monitoring tasks. A stethoscope that intensifies auscultatory sounds is called phonendoscope.
To use a stethoscope, manual, you will have to “learn” to listen with stethoscope.
For this I recommend a few “lessons” from You Tube:
If you want, in Youtube you’ll find more.
For stethoscope, the seven letters:
A. Snoring sound, high intensity and low tone
B. Rales dry (dry = continuous vibration)
C. Are related to hypersecretion of mucus
D. They are characteristic of acute bronchitis and chronic
E. As under exhale and inhale
F. Have the possibility of changing the number or location after coughing if he can mobilize secretions.
G. characters can be unilateral or bilateral, depending on the different stretches etiopathology.
About Pneumonia
Pneumonia is an infection of the lungs, filling them with fluid. It causes cough and fever and can make breathing difficult. Pneumonia can be caused by viruses, fungi or bacteria. Bacterial organisms such as Haemophilus influenzae and Streptoccocus pneumoniae cause more than 50% of pneumonia deaths in children under 5 years of age. Severe pneumonia can be deadly.
Pneumonia kills more children under the age of five than any other disease. Approximately 1.5 million children die from pneumonia every year; 98% of those occur in developing nations. One child dies from pneumonia every 20 seconds; that’s 4,300 young lives lost every day.
The World Health Organization and UNICEF produce a set of guidelines to train health workers to diagnose and manage diseases such as pneumonia, diarrhoea, and malaria called the Integrated Management of Childhood Illnesses (IMCI).
The IMCI guidelines train health workers to diagnose pneumonia by counting the respiratory rate and recognizing signs of respiratory distress such as subcostal recessions, chest indrawing and tracheal tug. Respiratory rate counting is only moderately accurate and many health workers count rates badly or not at all. Improved diagnosis is not the whole solution but could save many thousands of children’s lives every year.
For more information on pneumonia in developing world, please visit the World Pneumonia Day website and help them raise the awareness of this problem.
The StethoMic Peripheral
The StethoMic is a low-cost digital stethoscope that we’ve prototyped from off-the-shelf components. By utilising the powerful digital signal processing chips on modern smartphones, the StethoMic minimizes the need for custom circuitry and electronic components. This allows us to develop the device at a much lower-cost than regular digital stethoscopes out in the market.
A benefit of simplifying the design of the digital stethoscope attachment is that it is now possible for people in the developing world to make their own devices based on our design. A local technician with access to sufficient training and the right materials can produce our digital stethoscopes thereby empowering communities to be self-reliant.
By virtue of of the StethoMic’s connection to smartphones, our digital stethoscope unlike other digital stethoscopes is able to directly connect to the Internet. By connecting to the Internet, we harness our cloud database of breath sounds and sophisticated algorithms to provide diagnostic clinical decision support to the health worker at the point of care.
Mobile Apps
StethoCloud currently runs on Windows Phone, Android and legacy J2ME compatible phones. An iOS version of the app is currently in development.
Our apps have been developed for clinical use by health workers in developing countries. Thus, we base the design, flow and content of the apps on the IMCI Guidelines. The apps guide the health worker in the assessment of a child with questions based off the IMCI Guidelines. We augment the current guidelines with content such as photos and videos explaining the different signs of the disease.
By connecting the StethoMic to a smartphone running our app, a health worker is able to record a child’s breath sounds. The StethoCloud app is able to perform basic offline analaysis on the recorded breath sounds thanks to our prorprietary BioSignals algorithm suite.
The BioSignals algorithms are optimized digital signal processing algorithms that enable even low-powered feature phones to analyse breath sounds and calculate the respiratory rate of a child. Based off the IMCI guidelines, obtaining an objective measure of respiratory rate will help with the diagnosis and triage of the disease.
Although obtaining a respiratory rate is a highly sensitive measure of a child’s risk of pneumonia, it is unfortunately also highly non-specific. A child’s increase in respiratory rate may be caused by many other different diseases such as anemia or anxiety. This leads to many false positive results.
By connecting our apps to the cloud, we are able to upload the recorded breath sounds for further processing by sophisticated machine learning algorithms based on Big Data data mining techniques to increase the specificty of the diagno
Cloud Infrastructure
StethoCloud is unique from other digital stethoscopes because we harness the power of cloud computing to create the artificial intelligence that makes our stethoscopes “smart”.
By using scalable cloud storage facilities provided by Microsoft’s Windows Azure platform, we are building the world’s largest database on breath and heart sounds. Through this database, we will be able to train our machine learning algorithms to extract features and perform knowledge discovery of breath sound patterns and their related pathologies.
This training will enable the machine to accurately diagnose pneumonia, asthma and other respiratory diseases with at least the same level of sensitivty and specificity as human diagnosticians
From Google Play:
Heart Sounds (+ Lung Sounds)
Medical Doctor Apps – January 21, 2013
Medical
Android Stethoscope
Almor – July 28, 2013
Health & Fitness
Baby Heartbeats
Medroid Apps – July 29, 2013
Medical
You Tube:
Bluetooth Stethoscope & Wireless Heart Monitor
Littmann Stethoscope 3200 (bluetooth)
V SCAN
Visit https://vscan.gehealthcare.com/
An intuitive pocket-sized ultrasound device that enables medical professionals including cardiologists, general practitioners, OB/GYN, primary care, emergency physicians and intensivists to easily image at the point of care – transforming the physical exam with more information to determine the optimized course of treatment for patients.

Vscan clinical applications
Vscan is used by healthcare professionals including cardiologists, general practitioners, OB/GYN, primary care emergency physicians and intensivists. Vscan is used in a wide variety of settings from hospitals in large cities to clinics in rural areas or for use as an education tool at medical schools.
It offers high-quality imaging that is indicated for abdominal, urological, cardiac, obstetric and pediatric scanning – helping you provide efficient patient care with fewer referrals.
To publish your photo in Monitor selection proceed in the following manner:
Go to the Vscan module, access manual mode and you will see the following screen.
Click in the gray zone and will send the photo or gallery. From here you can load (to Monitor Selection) desired image.

It has USB option to connect, and you may have photos for you baby.
Go in YouTube and search : V Scan, you’ll find a lot of materials.
About “Monitor selection” who is one”results table” I give you one ex, how it will look:
Monitor Selection (table of result).
The results who not will be in this limits, applications must to warning visual and audio !!!!
Will have a option to attach a Graph, or to add Notes, for all.
General options for E mail,Phone/TXT,Print,SD card.
Reminder options for appointements,pill reminder, etc.
| Parameter | Value | Rate | Date |
|---|---|---|---|
| Temperature | 37*C | 36,5*C – 37,2*C | 25/3/2013 |
| Height | 172 cm | Man/age: Woman/age: |
25/3/2013 |
| Weight | 70 kg | Man: Woman: |
25/3/2013 |
| Glucose | 59mmol/L | 50-70 mmol/L | 25/3/2013 |
| Pulse | 120mmHg,80mmHg,87/min | Systolic 100-120,Dyastol<85,60-100bpm | 25/3/2013 |
| ECG | Attach Photo | -Average -Normal -High |
25/3/2013 |
| Stethoscope | 80bp/min, A | 30/250bpm | 25/3/2013 |
| V Scan | Attach Photo | 25/3/2013 |